

Dashboard & metrics
Dashboard & metrics
The at-a-glance view of order volume, risk, and validation activity.
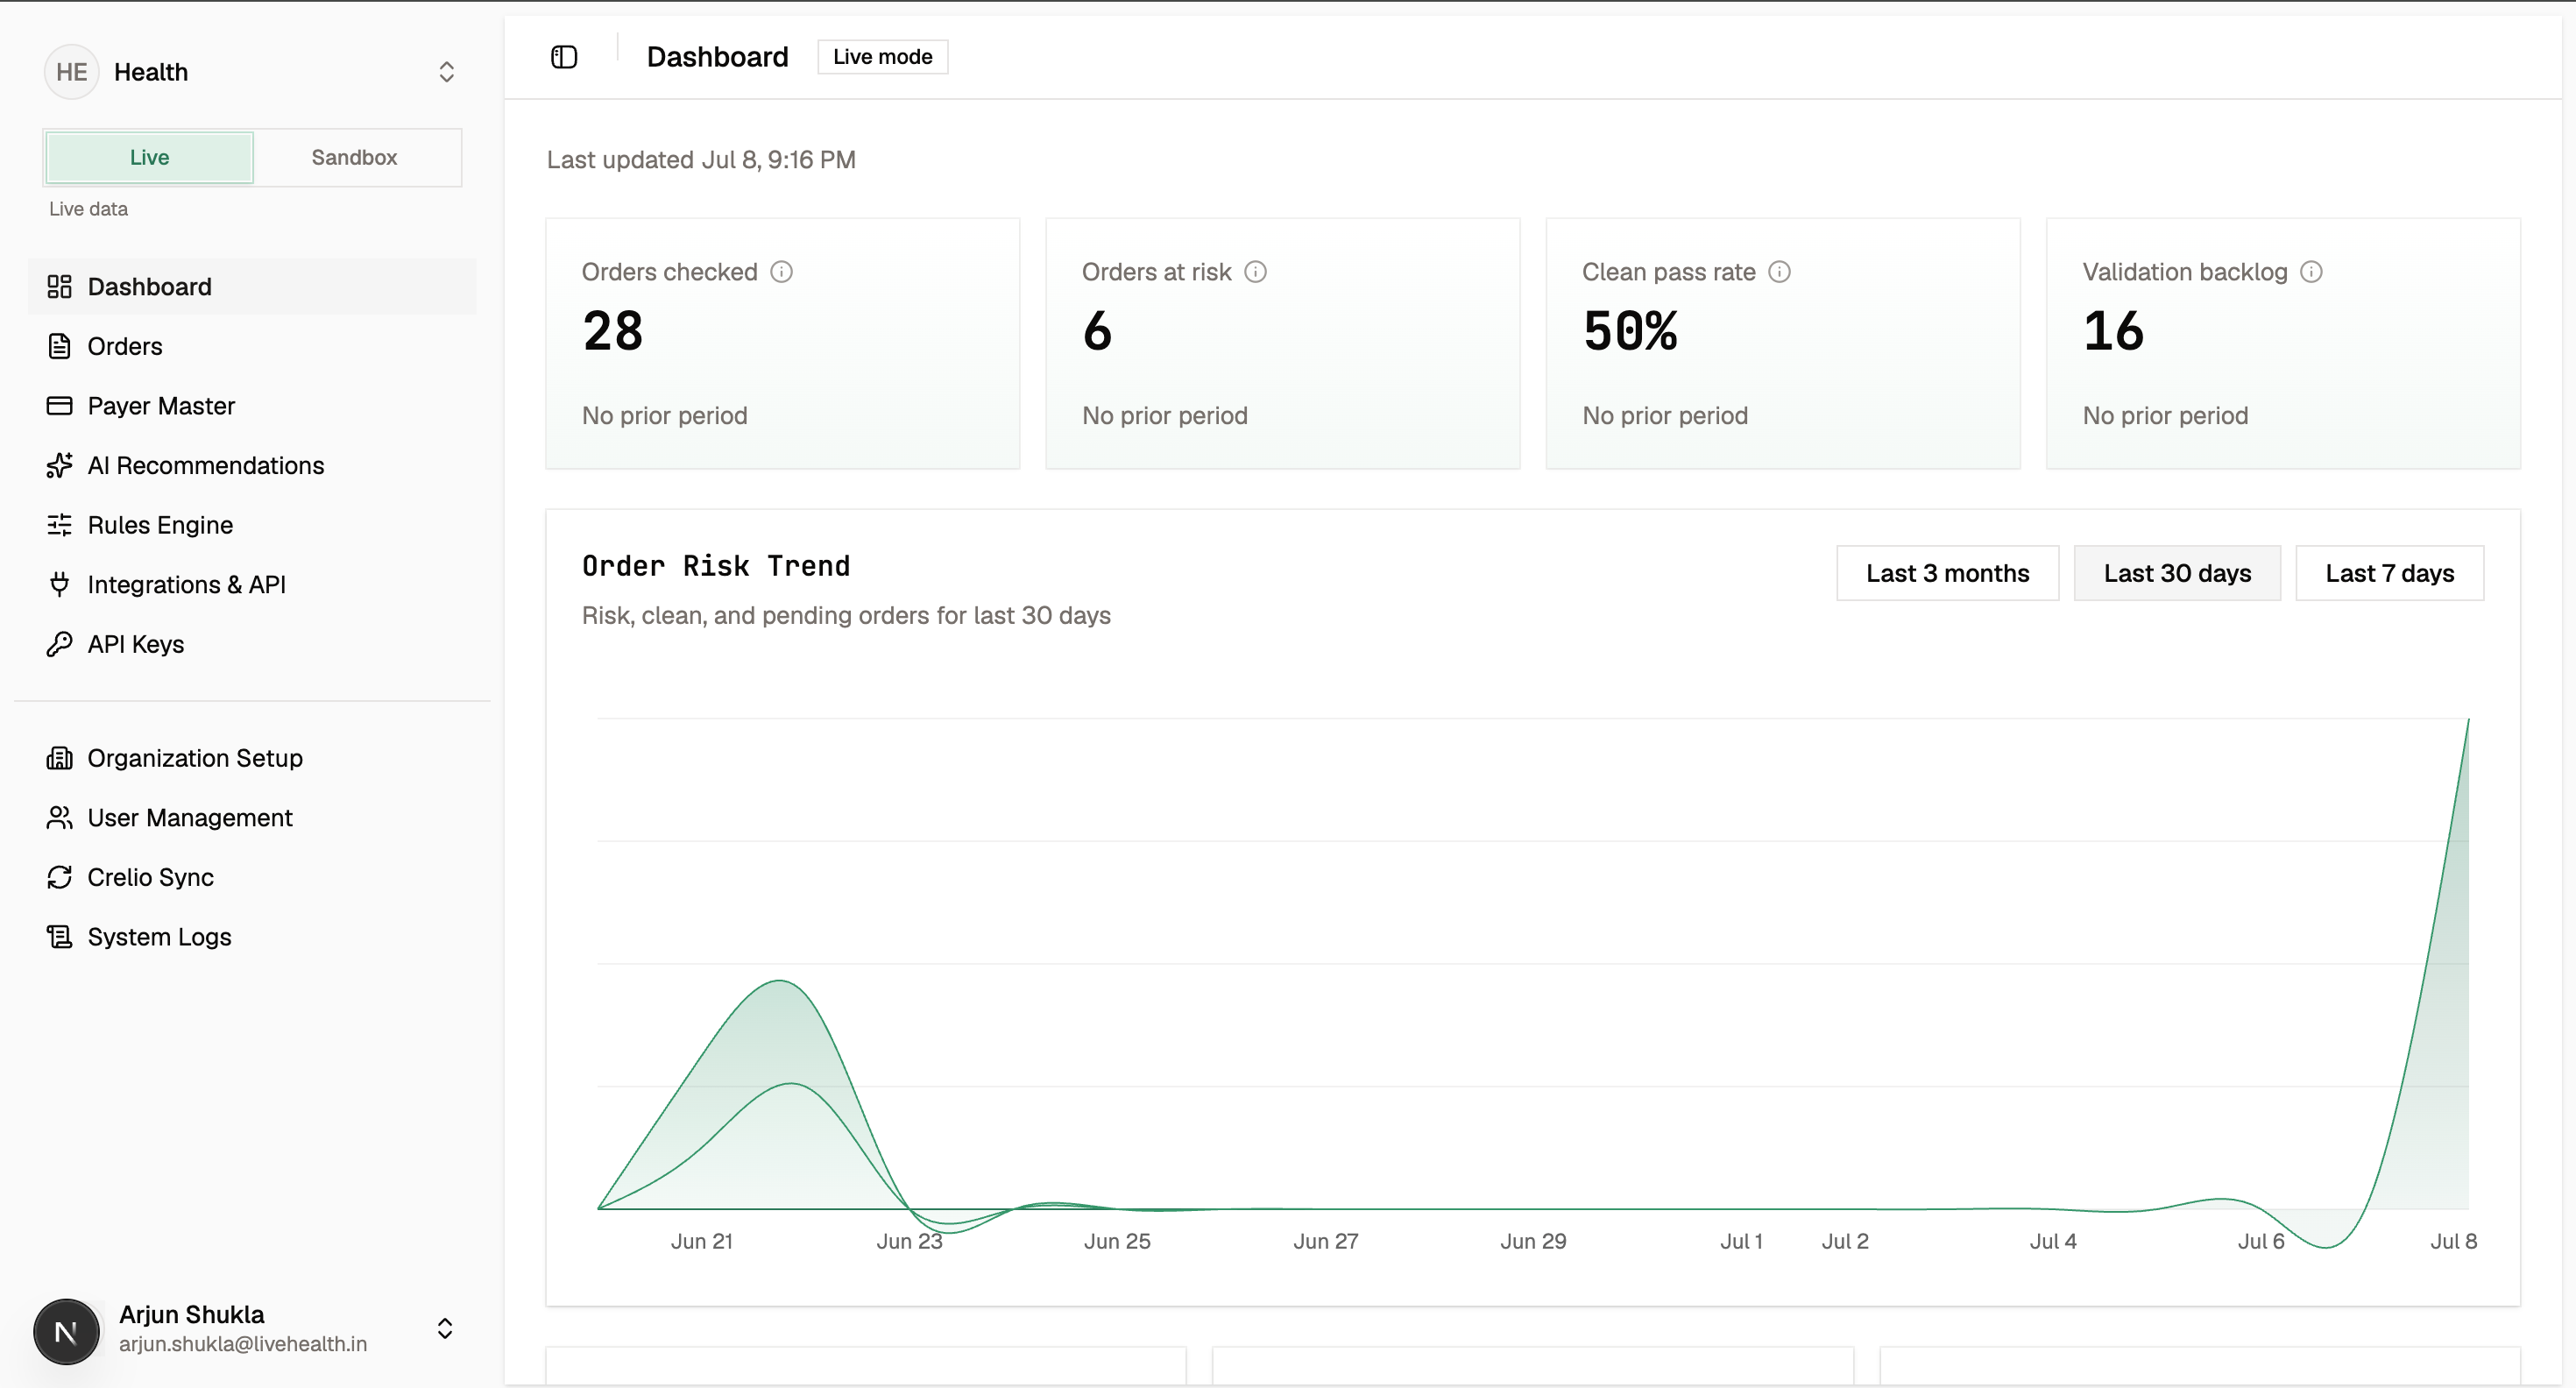
The Dashboard is the landing view of Revenue Guard. It summarizes activity for the environment you have selected, so switching between live and sandbox re-scopes every metric on the page.
What it shows
- Summary metrics — headline counts such as order volume, orders at risk, and pending review, for the active environment.
- Activity charts — trends over time so you can see how order flow and risk are moving.
Where to go next
The dashboard is a starting point. From here you’ll typically move into a focused workflow:
Orders
Triage validated orders, review findings, and manage review state.
Payer Master
Manage payers and upload policy documents.
System Logs
Audit what happened across your organization.
Every metric on the dashboard reflects the active environment. Use the live/sandbox switcher to change what you’re looking at.